vue1.x+typescript引入echarts
最近在用node写服务层,了解到koa,express,async等,玩了几天的MongoDB,mysql,redis,发现后台服务真的很有趣,要深入研究的东西层出不穷。今天公司开会csp项目要新增数据分析功能模块,前端也就是用echarts展示下数据图表就行了,十分简单啊。之前其他项目都用highcharts做过了数据图表展示的功能,只是没有用vue去写过而已。不过项目中用的是早已过时的vue1.0+typescript的框架,担心的是echarts不能够很友好的引入,看来是我多虑了,以下记录下引入echarts方法。唉,这迭代下面就把项目用vue2重构下,不能再拖了。。。
1.安装echarts
npm install echarts -g --save
安装完成后,package.json中有对应的版本号

安装TS头文件
typings install echarts=github:DefinitelyTyped/DefinitelyTyped/echarts/echarts.d.ts#3305eb6f74a2de17d208dfaaa20d69cfb912f871 --save --global

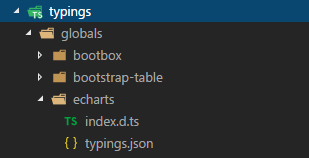
安装完成后typings文件夹下有对应的文件,这下引入echarts模块就不会报not found echarts module啦。
如果typings命令报错的,先安装typings
npm install typings -g --save
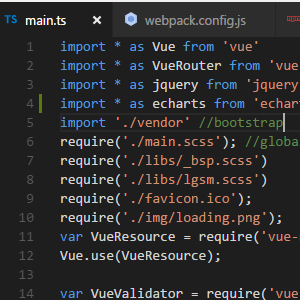
2.在main.js中引用echarts

我这边是ts
3.在页面内写入为echarts渲染的dom元素,设置固定高度否则不美观

4.在ts文件内引入echarts对应模块,并写入对应逻辑代码
这边就直接放在ready()内
// 引入基本模板,如果在项目中对体积要求比较苛刻,也可以只按需引入需要的模块(可以按需引入的模块列表)
 // let echarts = require('echarts/lib/echarts')
        // 例如:引入柱状图
        // require('echarts/lib/chart/bar');
        let chartBox = document.getElementById('charts')
        let myChart = document.getElementById('myChart')
        function resizeCharts() {//为调整图标尺寸的方法
            myChart.style.width = chartBox.style.width + 'px'
            myChart.style.height = chartBox.style.height + 'px'
        }
        let mainChart = echarts.init(myChart)// 基于准备好的dom,初始化echarts实例
        var option = null;
        // 指定图表的配置项和数据
        option = {
            title: {
                text: 'ECharts图表'
            },
            tooltip: {},
            legend: {
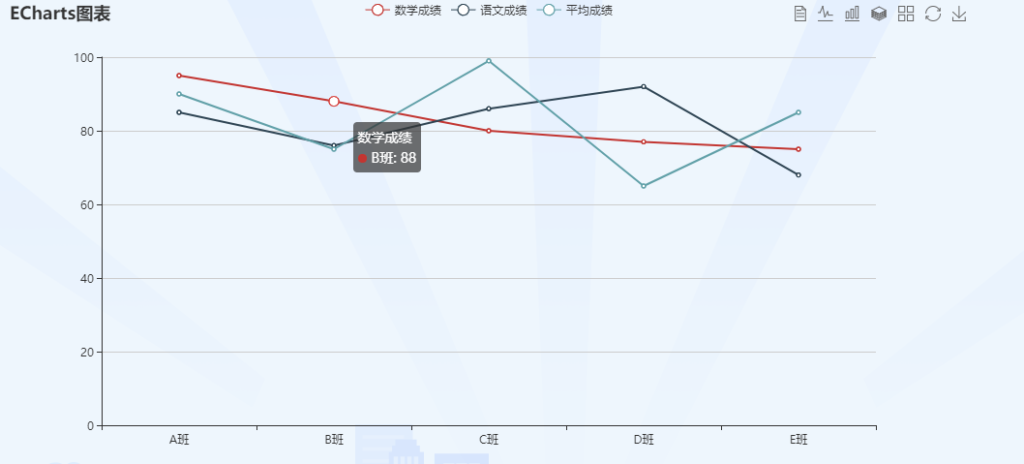
                data: ['数学成绩','语文成绩','平均成绩']
            },
            xAxis: {
                data: ["A班", "B班", "C班", "D班", "E班"]
            },
            yAxis: {},
            toolbox: {
                show : true,
                feature : {
                    mark : {show: true},
                    dataView : {show: true, readOnly: false},
                    magicType : {show: true, type: ['line', 'bar', 'stack', 'tiled']},
                    restore : {show: true},
                    saveAsImage : {show: true}
                }
            },
            series: [{
                name: '数学成绩',
                type: 'line',
                data: [95, 88, 80, 77, 75]
            },
            {
                name: '语文成绩',
                type: 'line',
                data: [85, 76, 86, 92, 68]
            },
            {
                name: '平均成绩',
                type: 'line',
                data: [90, 75, 99, 65, 85]
            }
        ]
        };
        // 使用刚指定的配置项和数据显示图表。
        if (option && typeof option === "object") {
            mainChart.setOption(option, true)
        }
最后npm run dev运行查看,完美展现!


